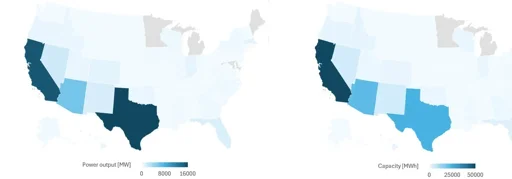
CAISO and ERCOT hold two-thirds of U.S. battery capacity, face the same cannibalization risk, and are the only empirical roadmap the rest of the country has
It’s a great resource. I use it when seasons change to get a sense of when is the best time to charge my car, with whatever time of day and weather conditions that have high renewable generation and/or low demand so that I don’t feed into fossil fuel demand if I can avoid it.
Solar. The labels are not super helpful on that screenshot, but you can go to the website and see the graphs in greater detail. Plus at this moment, you’ll be able to see the battery discharge stats.

I’ll just leave this here, in case there are some other electric grid nerds out there: https://www.gridstatus.io/trends?period=year&metric=battery-discharge
Really neat site with nearly real time data.
It’s a great resource. I use it when seasons change to get a sense of when is the best time to charge my car, with whatever time of day and weather conditions that have high renewable generation and/or low demand so that I don’t feed into fossil fuel demand if I can avoid it.
So what’s the yellow?
Solar. The labels are not super helpful on that screenshot, but you can go to the website and see the graphs in greater detail. Plus at this moment, you’ll be able to see the battery discharge stats.
Solar - here’s those same two charts(albeit later in the day) with the full keys.